Monitor Linux Ubuntu System resources like CPU, Disk IO and Network. Install Collectl, all-in-one performance monitoring tool for Linux Ubuntu. Collectl collects all the data that describes the current system status. The app write all the data from live system to file or display on Terminal.
Collectl is a command-line utility for Linux Ubuntu System administrators. The tool that collects and shows the system performance data, the current system status. It shows all the different types of system resources such as cpu, disk, memory, network, sockets, tcp, inodes, memory, nfs, processes and others.
The Collectl works in two different modes:
- Record Mode – read data from live system and write to file or display on terminal
collectl [-f file] [options] - Playback Mode – read data from one or more raw data files and display on terminal
collectl -p file1 [file2 …] [options]
Collectl can run interactively, as a daemon or both. The command displays the output in many formats and can record and playback the captured data. By default, it displays the data in the Terminal. If you want to save the data, it can also export the data in various file formats.
How to install collectl tool
Run the following commands in Terminal to install collectl in Debian or Ubuntu or Linux Mint Systems:
sudo apt-get install collectl
How to use collectl commands
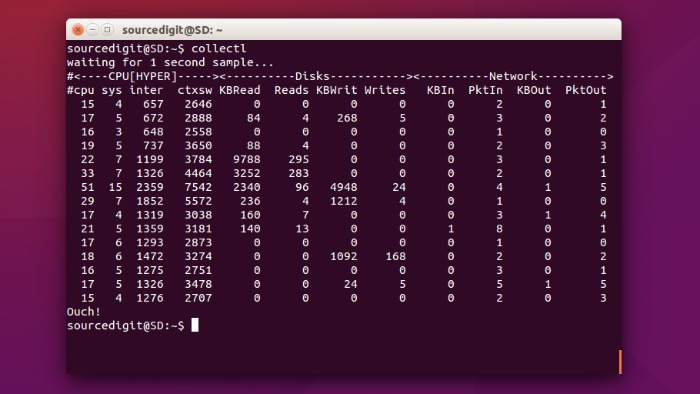
Once the installation is finished, the collectl can be used in Terminal, even without any option or parameters.
collectl

The collectl command displays interrupts, memory usage and nfs activity with timestamps.
The collectl commands can be used using with more than one parameters. The summary list of collectl command parameters are.
- b – buddy info (memory fragmentation)
- c – CPU
- d – Disk
- f – NFS V3 Data
- i – Inode and File System
- j – Interrupts
- l – Lustre
- m – Memory
- n – Networks
- s – Sockets
- t – TCP
- x – Interconnect
- y – Slabs (system object caches)
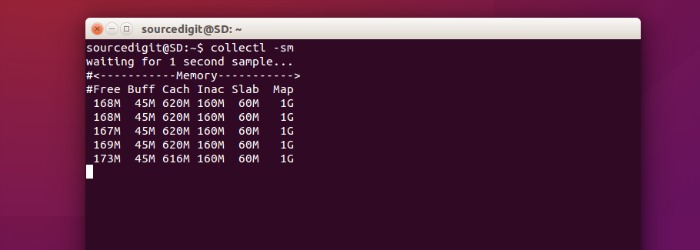
For example to known the status of system memory, use the command:
collectl -sm

You can also use scdn command. The default option is “cdn”. The commands stands for CPU, Disks and Network Data.
collectl scdn

You can also use the command to display the information in verbose format.
collectl -sjmf -oT
You actually see the network traffic stall while waiting for the server to physically write the data.

