How to check which process is using more memory in Linux Ubuntu. Display Linux memory usage by process; on Linux how much memory is a process using.
This post explains how to check memory usage of particular process in Linux using Terminal commands:
Ubuntu users can easily see running processes in Linux Terminal using ps command. The ps reports a snapshot of the current processes. ps displays information about a selection of the active processes. It is slighyly different from top command. top command is used when you want a repetitive update of the selection and the displayed information.
By default, ps selects all processes with the same effective user ID (euid=EUID) as the current user and associated with the same terminal as the invoker. ps command displays the process ID (pid=PID), the terminal associated with the process (tname=TTY), the cumulated CPU time in [DD-]hh:mm:ss format (time=TIME), and the executable name (ucmd=CMD). By default, the display output is unsorted, but can be sorted using –sort options in recursive manner.
List Top Memory Consuming Processes In Terminal
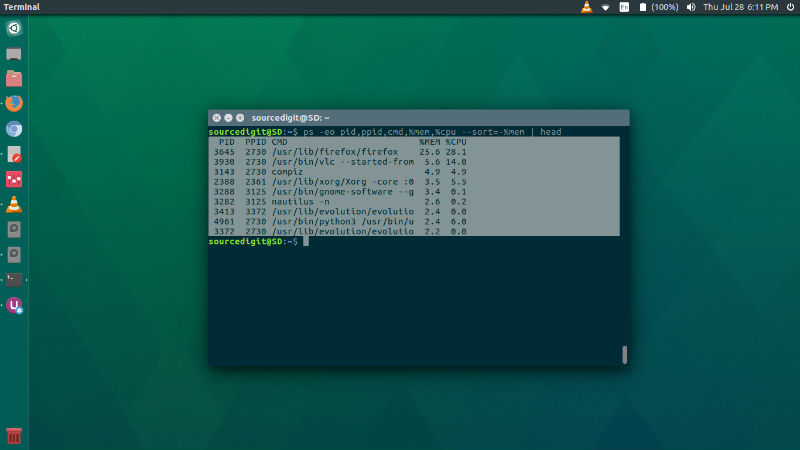
The ps command can be mixed with various options to show the list of top processes sorted by RAM and CPU usage. Run the following command in Terminal to see the top running processes by RAM and CPU usage:
$ ps -eo pid,ppid,cmd,%mem,%cpu --sort=-%mem | head
Below is the screenshot of the command output:

Explaining the command and all the options users:
- -A Select all processes. Identical to -e.
- -e Select all processes. Identical to -A.
- -o User-defined format. Option of ps allows to specify the output format. Format is a single argument in the form of a blank-separated or comma-separated list, which offers a way to specify individual output columns.
- –pid pidlist process ID. Identical to -p and p.
- –ppid pidlist parent process ID. This selects the processes with a parent process ID in pidlist. That is, it selects processes that are children of those listed in pidlist.
- –sort Specify sorting order.
- cmd simple name of executable
- %cpu CPU utilization of the process in “##.#” format. Currently, it is the CPU time used divided by the time the process has been running (cputime/realtime ratio), expressed as a percentage.
- %mem Ratio of the process’s resident set size to the physical memory on the machine, expressed as a percentage.
List Top 10 CPU Consuming Processes
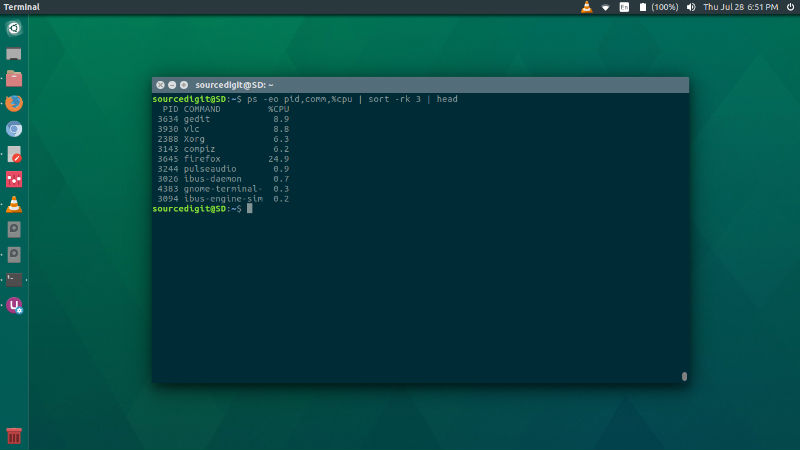
Similarly you can also print the top 10 CPU consuming processes. Run the following command given below:
ps -eo pid,comm,%cpu | sort -rk 3 | head
List Top 10 CPU & Memory Consuming Processes
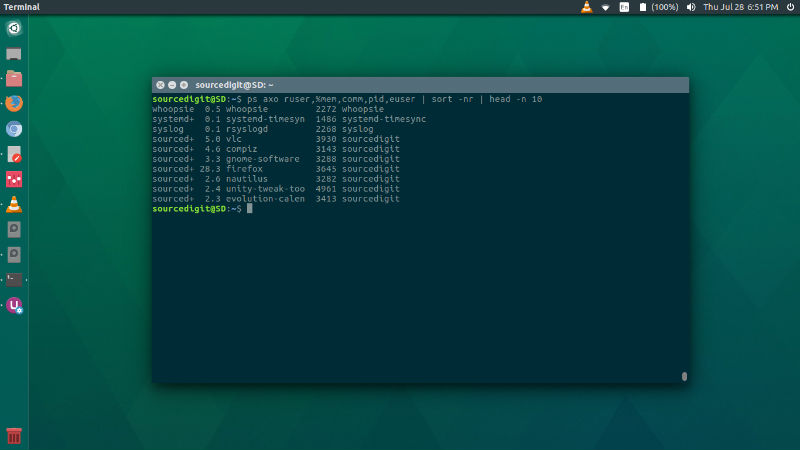
Run the following command to list top 10 CPU and Memory consuming processes:
ps axo ruser,%mem,comm,pid,euser | sort -nr | head -n 10
Using ps Command
ps displays information about a selection of the active processes. There are various options that can be used with the ps command. Below are the some of the most basic usage of the ps command.
To see every process on the system using standard syntax:
ps -e

ps -ef

ps -eF

ps -ely
To see every process running as root (real & effective ID) in user format:
ps -U root -u root u
To see top process running as root (sorted in order):
ps -U root -u root u --sort=-%mem | head
To see every process on the system using BSD syntax:
ps ax

ps axu
To get security info:
ps -eo euser,ruser,suser,fuser,f,comm,label

ps axZ

ps -eM
To print a process tree:
ps -ejH

ps axjf
To get info about threads:
ps -eLf

ps axms


