Performance Monitoring Tool for Linux Ubuntu Systems. Install Netdata on Ubuntu Systems. Netdata is a real-time monitoring tool for Linux Ubuntu Systems.
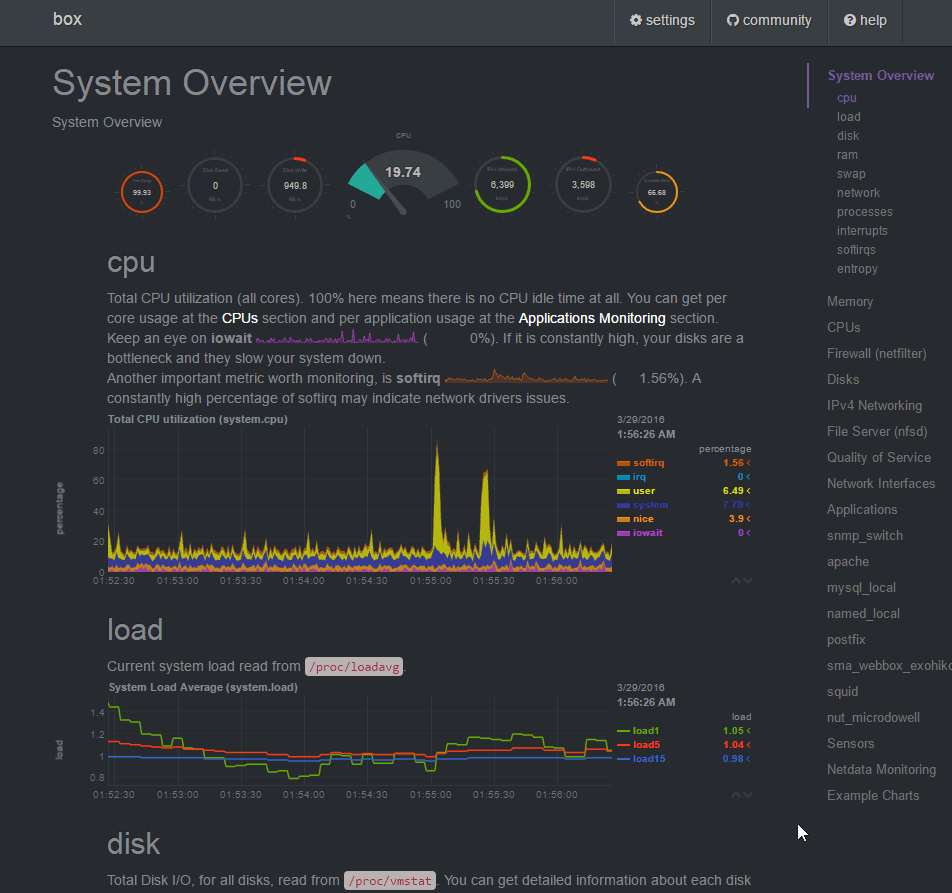
netdata is a highly optimized Linux daemon providing real-time performance monitoring for Linux systems, Applications, SNMP devices, over the web. The application tries to visualize the truth of now, in its greatest detail, so that you can get insights of what is happening now and what just happened, on your systems and applications.

This is what you get:
- Beautiful out of the box bootstrap dashboards
- Custom dashboards that can be built using simple HTML (no javascript necessary)
- Blazingly fast and super efficient, written in C (for default installations, expect just 2% of a single core CPU usage and a few MB of RAM)
- Zero configuration – you just install it and it autodetects everything
- Zero dependencies, it is its own web server for its static web files and its web API
- Extensible, you can monitor anything you can get a metric for, using its Plugin API (anything can be a netdata plugin – from BASH to node.js)
- Embeddable, it can run anywhere a Linux kernel runs
What does it monitor?
This is what it currently monitors (most with zero configuration):
- CPU usage, interrupts, softirqs and frequency (total and per core)
- RAM, swap and kernel memory usage (including KSM and kernel memory deduper)
- Disk I/O (per disk: bandwidth, operations, backlog, utilization, etc)
- Network interfaces (per interface: bandwidth, packets, errors, drops, etc)
- IPv4 networking (packets, errors, fragments, tcp: connections, packets, errors, handshake, udp: packets, errors, broadcast: bandwidth, packets, multicast: bandwidth, packets)
- netfilter / iptables Linux firewall (connections, connection tracker events, errors, etc)
- Processes (running, blocked, forks, active, etc)
- Entropy
- NFS file servers, v2, v3, v4 (I/O, cache, read ahead, RPC calls)
- Network QoS (yes, the only tool that visualizes network classes in realtime)
- Applications, by grouping the process tree (CPU, memory, disk reads, disk writes, swap, threads, pipes, sockets, etc)
- Apache web server mod-status (v2.2, v2.4)
- Nginx web server stub-status
- mySQL databases (multiple servers, each showing: bandwidth, queries/s, handlers, locks, issues, tmp operations, connections, binlog metrics, threads, innodb metrics, etc)
- ISC Bind name server (multiple servers, each showing: clients, requests, queries, updates, failures and several per view metrics)
- Postfix email server message queue (entries, size)
- Squid proxy server (clients bandwidth and requests, servers bandwidth and requests)
- Hardware sensors (temperature, voltage, fans, power, humidity, etc)
- NUT UPSes (load, charge, battery voltage, temperature, utility metrics, output metrics)
Install netdata on Ubuntu

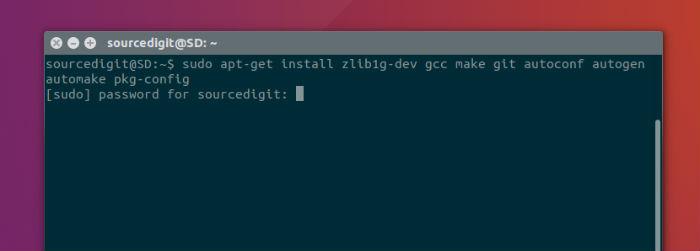
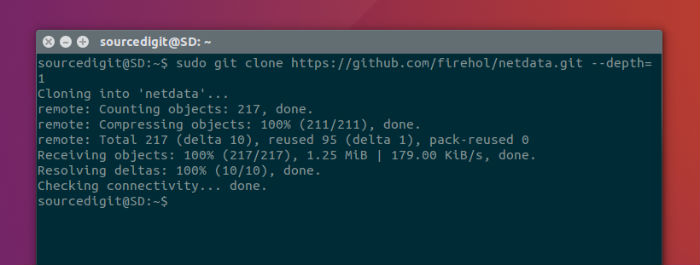
Run the following commands to install netdata repository from git:
sudo apt-get install zlib1g-dev gcc make git autoconf autogen automake pkg-config

sudo git clone https://github.com/firehol/netdata.git --depth=1

sudo cd netdata

sudo ./netdata-installer.sh

Once installed, open the netdata application. Run the following command:
sudo /usr/sbin/netdata
You can also open netdata in browser. Open the following address to access it:
sudo http://127.0.0.1:19999/
https://github.com/firehol/netdata/
