How to check CPU temperature in Ubuntu Linux. Here are the tools and command to check CPU temperature in Ubuntu System. See how to check Linux CPU temperature via command line in Ubuntu:
1. Glances
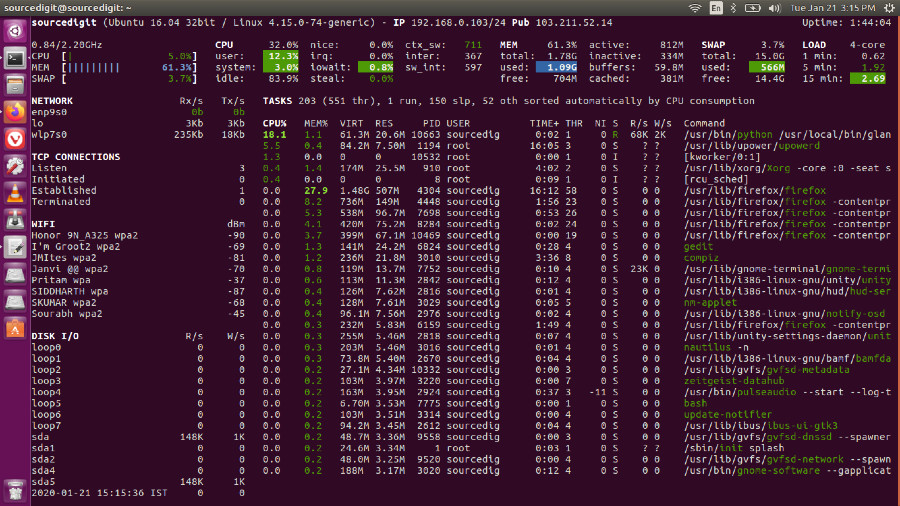
Glances is a cross-platform system monitoring tool written in Python. Written in Python, Glances will run on almost any plaftorm : GNU/Linux, FreeBSD, OS X and Windows. Glances includes a XML-RPC server and a RESTful JSON API which can be used by another client software. It can easily export all system statistics to CSV, InfluxDB, Cassandra, OpenTSDB, StatsD, ElasticSearch or even RabbitMQ. Glances also provides a dedicated Grafana dashboard.
Glances is a cross-platform monitoring tool which aims to present a maximum of information in a minimum of space through a curses or Web based interface. It can adapt dynamically the displayed information depending on the terminal size.
Features:
1. CPU
2. Memory
3. Load
4. Process list
5. Network interface
6. Disk I/O
7. IRQ / Raid
8. Sensors
9. Filesystem (and folders)
10. Docker
11. Monitor
12. Alert
13. System info
14. Uptime
15. Quicklook (CPU, MEM, LOAD)

Install Glances
sudo apt-get -y --force-yes update

sudo pip install --upgrade pip

wget -O- https://bit.ly/glances | /bin/bash
Or
sudo apt-add-repository ppa:arnaud-hartmann/glances-stable

sudo apt-get update

sudo apt-get install glances
Once installed, run the command “glances” to display the CPU Processor information. Press ‘q‘ or (‘ESC‘ or ‘Ctrl&C‘ also works) to quit from Glances terminal.
Command-Line Options
-h, –help – show this help message and exit
-V, –version – show program’s version number and exit
A – Enable/disable Application Monitoring Process
b – Switch between bit/s or Byte/s for network I/O
B – View disk I/O counters per second
c – Sort processes by CPU usage
d – Show/hide disk I/O stats
D – Enable/disable Docker stats
e – Enable/disable top extended stats
E – Erase current process filter
f – Show/hide file system and folder monitoring stats
F – Switch between file system used and free space
g – Generate graphs for current history
h – Show/hide the help screen
i – Sort processes by I/O rate
I – Show/hide IP module
k – Show/hide TCP connections
l – Show/hide log messages
m – Sort processes by MEM usage
M – Reset processes summary min/max
n – Show/hide network stats
N – Show/hide current time
p – Sort processes by name
q|ESC|CTRL-C – Quit the current Glances session
Q – Show/hide IRQ module
r – Reset history
R – Show/hide RAID plugin
s – Show/hide sensors stats
t – Sort process by CPU times (TIME+)
T – View network I/O as combination
u – Sort processes by USER
U – View cumulative network I/O
w – Delete finished warning log messages
W – Show/hide Wifi module
x – Delete finished warning and critical log messages
z – Show/hide processes stats
0 – Enable/disable Irix/Solaris mode
1 – Switch between global CPU and per-CPU stats
2 – Enable/disable left sidebar
3 – Enable/disable the quick look module
4 – Enable/disable all but quick look and load module
5 – Enable/disable top menu (QuickLook, CPU, MEM, SWAP and LOAD)
6 – Enable/disable mean GPU mode
2. hardinfo
Hardinfo is a system profiler and benchmark tool for Linux Ubuntu systems. It is able to obtain information from both hardware and basic software, and organize it in a simple to use GUI.
Features include:
1. Report generation (in either HTML or plain text)
2. Benchmark result synchronization
3. Ability to explore the information on remote computers
HardInfo currently detects most software and hardware detected by the OS. Features: The remote sync was disabled due to server loss. Development: Currently done by contributors, a new dedicated maintainer is needed.
sudo apt install hardinfo
hardinfo -rma devices.so
Most hardware is detected automatically by HardInfo, however, some hardware needs manual set up. They are:
1. lm-sensors: If your computer is compatible with lm-sensors module, use by example the sensors-detect program included with the lm-sensors package of Debian based distros, and be sure to have the detected kernel modules loaded.
2. hddtemp: To obtain the hard disk drive temperature, be sure to run hddtemp in daemon mode, using the default port.
3. The module eeprom must be loaded to display info about your currently installed memory. Load with modprobe eeprom and refresh the module screen.
