
Glances is a system performance monitoring tool for Linux Ubuntu. Glances cross-platform monitoring tool presents a maximum of information in a minimum of space, ideally to fit in a classical 80×24 terminal or higher to have additional information.
The application can adapt dynamically the displayed information depending on the terminal size. It can also work in client/server mode. Remote monitoring could be done via terminal or web interface. Glances is written in Python and run on almost any plaftorm : GNU/Linux, FreeBSD, OS X and Windows. The best part, no terminal is used. SImply use the built-in Web UI and monitor your system from any device.
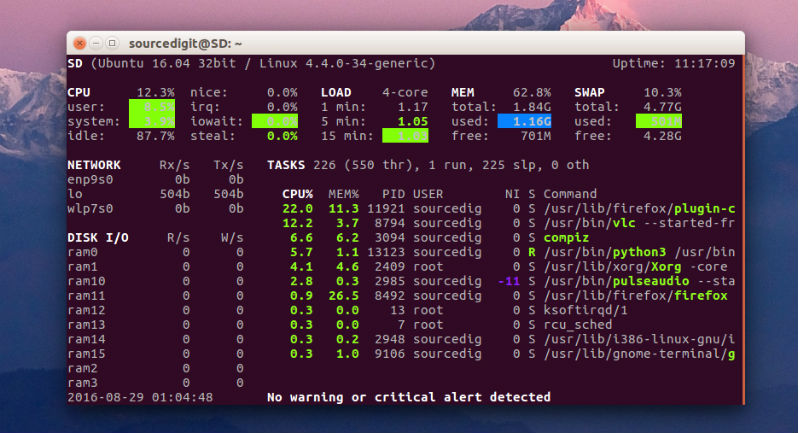
Glances monitoring tool export all system statistics to CSV, StatsD, InfluxDB, ElasticSearch or even RabbitMQ. Glances also provides a dedicated Grafana dashboard.
- CPU
- Memory
- Load
- Process list
- Network interface
- Disk I/O
- Raid
- Sensors
- Filesystem (and folders)
- Docker
- Monitor
- Alert
- System info
- Uptime
- Quicklook (CPU, MEM, LOAD)
Glances Auto Install Script
To install the latest Glances production ready version, just enter the following command line:
$ curl -L http://bit.ly/glances | /bin/bash
or
$ wget -O- http://bit.ly/glances | /bin/bash
Install Glances From Ubuntu Distribution Package
Run the following commands to install Glances on Linux Ubuntu Systems:
sudo apt-get install glances
Using Glances
Once installed, Glances can be used via Terminal. There are four basic color codes used to display information:
GREEN : Ok
BLUE : Careful
VIOLET : Warning
RED : Critical
In general, when glances command in executed, the following info is displayed:
CPU: The CPU stats are shown as a percentage and for the configured refresh time. The total CPU usage is displayed on the first line.
Memory: Glances uses two columns: one for the RAM and one for the SWAP.
If enough space is available, Glances displays extended information for the RAM:
Network: Glances displays the network interface bit rate. The unit is adapted dynamically (bit/s, kbit/s, Mbit/s, etc).
Disk I/O: Glances displays the disk I/O throughput. The unit is adapted dynamically.
File System: Glances displays the used and total file system disk space. The unit is adapted dynamically.
Process: The process view consists of 3 parts – Processes summary, Monitored processes list (optional) and Processes list.
Command-Line Options
-h, –help show this help message and exit
-V, –version show program’s version number and exit
Interactive Commands
The following commands (key pressed) are supported in Glances. In the Glances client browser (accessible through the –browser command line argument):
ENTER Set the process filter
ENTER Run the selected server
UP Up in the servers list
DOWN Down in the servers list
q|ESC Quit Glances
a Sort processes automatically
b Bytes or bits for network I/O
c Sort processes by CPU%
l Show/hide alert logs
m Sort processes by MEM%
w Delete warning alerts
u Sort processes by USER
x Delete warning and critical alerts
p Sort processes by name
1 Global CPU or per-CPU stats
i Sort processes by I/O rate
I Show/hide IP module
t Sort processes by TIME
D Enable/disable Docker stats
d Show/hide disk I/O stats
T View network I/O as combination
f Show/hide filesystem stats
U View cumulative network I/O
n Show/hide network stats
F Show filesystem free space
s Show/hide sensors stats
g Generate graphs for current history
2 Show/hide left sidebar
r Reset history
z Enable/disable processes stats
h Show/hide this help screen
3 Enable/disable quick look plugin
B Count/rate for Disk I/O
e Enable/disable top extended stats
5 Show/hide top menu (QL, CPU, MEM, SWAP and LOAD)
/ Enable/disable short processes name
0 Enable/disable Irix process CPU
q Quit (Esc and Ctrl-C also work)